
Get a snapshot of your sales performance and compare data by categories, marketing campaigns and specific time periods.
Contents:
- Overview
- Running a Basic Sales Report
- Grouping by Categories
- Product Drill Down Report
- Grouping by Trackers
- Grouping by Referrers
- Grouping by Coupons
- Filtering by Categories
- Date Comparison Tool
Overview
Sales reports give you an overview of your product sales performance. It allows you to compare your total sales against your profits.
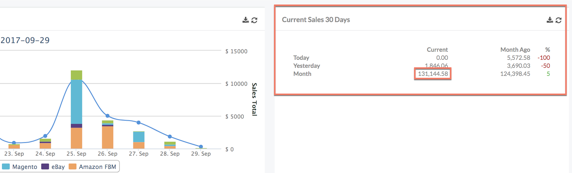
Report 1
Path: Dashboard
Formula To Calculate This Value = This is based on the entire monetary amount of all orders (regardless of status if shipped) for the current month based on order date (includes shipping, tax, etc). If any of the orders were later canceled, then the amount would be adjusted as such.
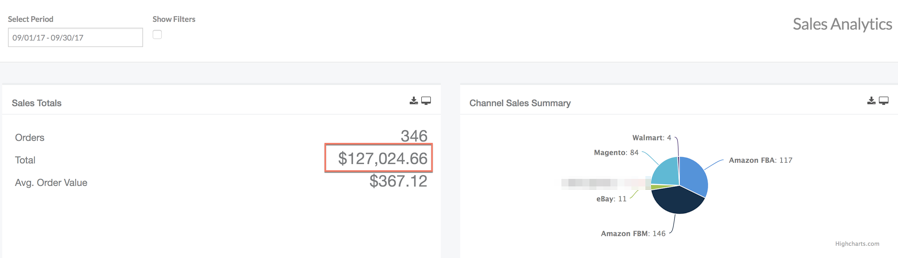
Report 2
Path: Analytics > Sales
Formula To Calculate This Value = This is based on the current month's shipped invoices by the shipped date (not order date). These are shipped, so the amount won't change in later months, even if refunded. You are likely to report your revenues by this shipped data.
Report 3
Path: Financials > Report > Sales > Current Month
Formula To Calculate This Value = This is based on the entire product amount, excluding tax, discount, shipping, etc. It's only the subtotals of the orders (regardless if the status is pending, processing, shipped, etc) for the current month based on order date. It's actually the same report as the dashboard (report 2), but it only counts the subtotals. If any of the orders were later canceled, then the amount would be adjusted as such.
For the purpose of this article, we will discuss the basic sales report found in Financials > Reports > Sales.
A number of options are also available to fine-tune the report. These include:
- Comparing by time frames
- Comparing by categories
- Comparing by trackers
- Comparing by referrers
- Comparing by coupons
- Filtering by product categories
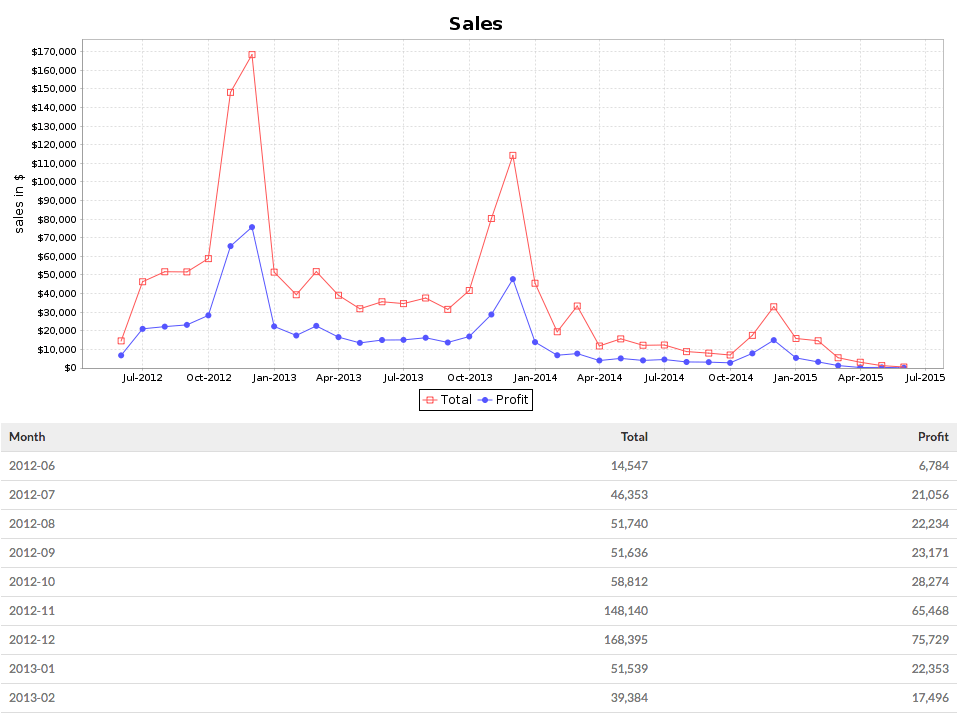
Running a Basic Sales Report
The basic sales report will give you a general overview of your total sales and profits from a specific time frame.
- From the main menu, navigate to Financials > Reports and select Sales.
- Select one of the radio buttons in the Time frame section. You can choose a preset time frame from the drop-down or specify a date range.
- Click Submit to run the report.

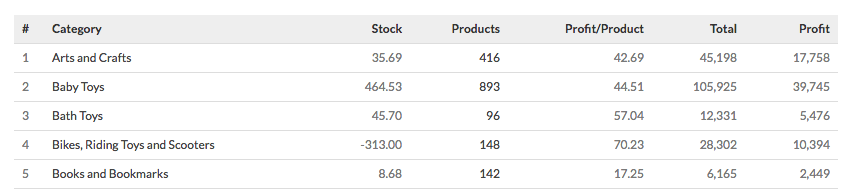
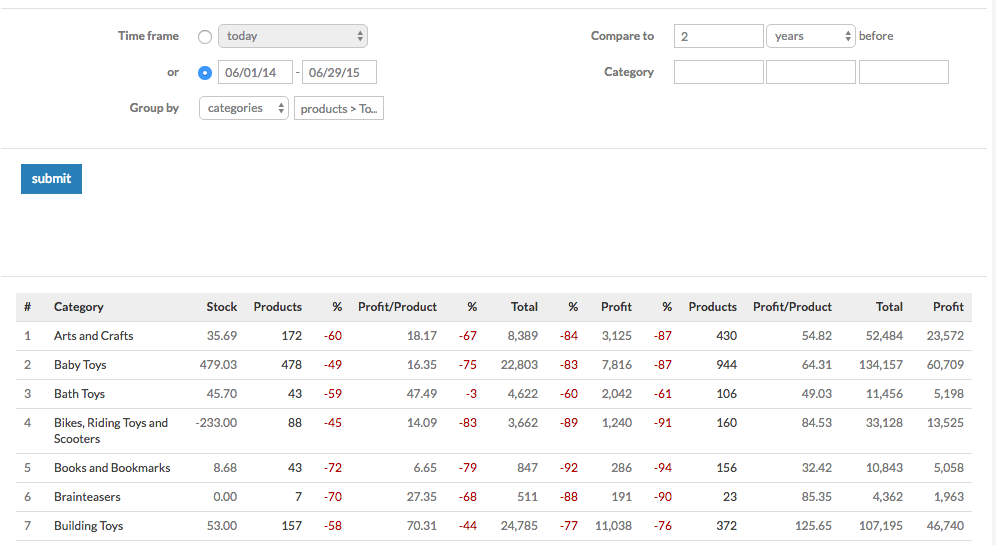
Grouping by Categories
Jazva gives you a number of tools to adjust your report based on groupings. This can be done by entering a Group by criterion.
The Category report gives you a breakdown of how much each product category sold during a specific time frame.
- Select a Time frame.
- Select categories from the Group by drop-down.
- In the autocomplete text field, start typing the category you wish to see, and select it from the list of choices. For example, you can use a main category branch such as “products”
- Click Submit.
- The report will list the following data:
- Category - Subcategories under the category branch selected
- Stock - Stock on hand in dollars
- Products - Number of products in that category
- Profit/Product - Profit per product in that category
- Total - total sales for that category in dollars
- Profit - total profit for that category in dollars
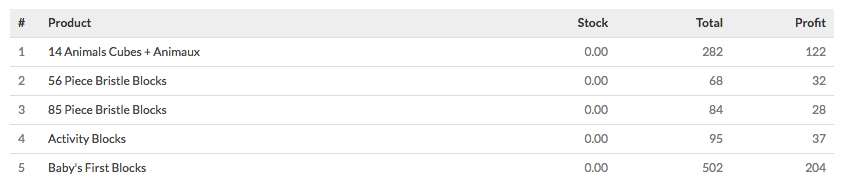
Product Drill Down Report
Category group reports can further be drilled down to see how much each product sold. After running a category group report, click on the subcategories until you reach the product reports page.
The report will list the following data:
- Product - Name of the product
- Stock - Stock on hand in dollars
- Total - Total sales for that product in dollars
- Profit - profit for that product in dollars
Group by Trackers
This report will show you sales performance data filtered by specific trackers. Trackers can be parameters you used to track specific campaigns.
- Select a Time frame.
- Select trackers from the Group by drop-down.
- Optional: enter a specific tracker name to filter by a campaign.
- Click Submit.
Grouping by Referrers
This report will show you sales performance filtered by referrers. Referrer data gives you insight on how your customers found your product page. Referrers include websites such as www.google.com and m.facebook.com.
- Select a Time frame.
- Select referrers from the Group by drop-down.
- Optional: enter a specific referrer name to filter by a referrer
- Click Submit.
Grouping by Coupons
This report will show you sales performance filtered by coupon campaigns you ran during a specific time frame. It also shows you the discounts applied, with your total sales data.
- Select a Time frame.
- Select coupons from the Group by drop-down.
- Optional: enter a specific coupon name to filter by a campaign.
- Click Submit.
Filtering by Categories
You can apply category filters to your basic reports. This lets you refine your data results to show only specific categories or products.
- Select a Time frame.
- From the top right corner of the page, apply category filters in the autocomplete text fields next to Category.
- You can add up to 3 category filters. Report results will include only data that matches all filters applied. In other words, sales data rendered would be for products that belong to all categories chosen in the filter.
- Filters need to be clicked from your category tree. Simply entering subcategories into the text fields may not load the correct results.
- Click Submit.
Date Comparison Tool
Jazva allows you to compare two sets of basic reports based on specific criteria.
- Specify a Time frame for the first report.
- Select a Compare to date for the second report. This can range from days to years before the first report
- Optional: apply Groupings or Category filters.
- Click Submit.
Your Total and Profit results will be paired with % columns to indicate the percent difference between the first report and the second report.
Comments
0 comments
Article is closed for comments.